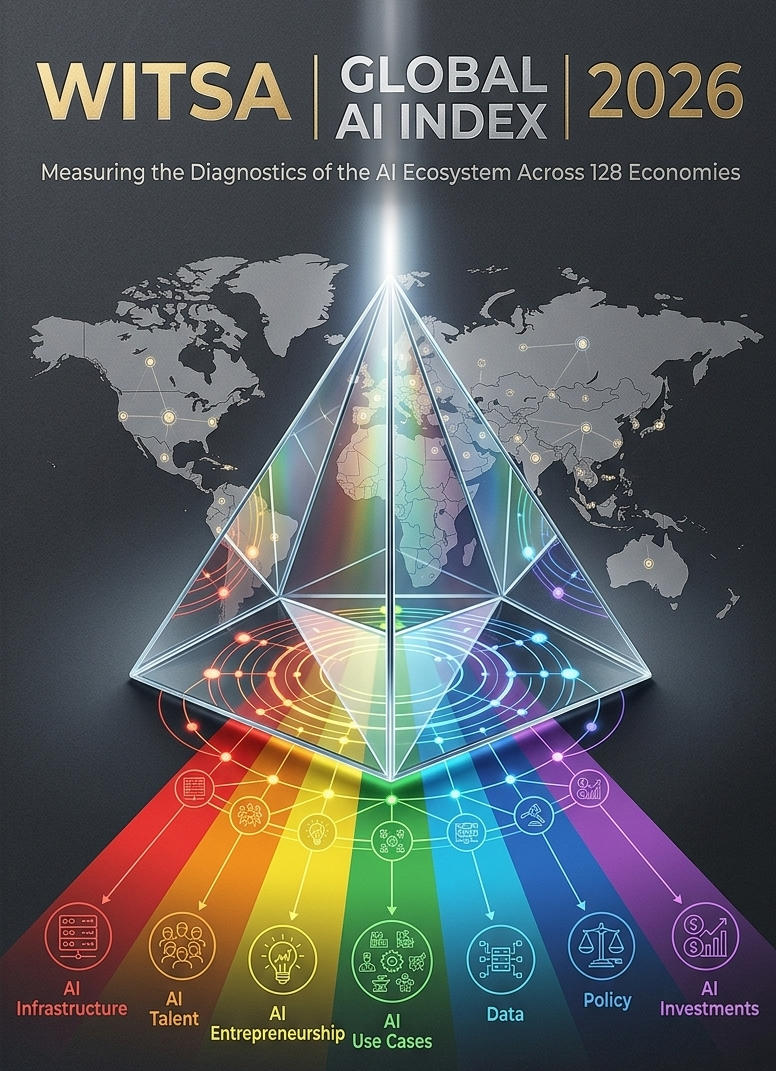
The finding. The WITSA Global AI Index measures 105 economies against 83 indicators across seven pillars of artificial intelligence capability, and tracks 23 more. Its central result is not that some economies are ahead of others, which was known. It is that the capability which most determines an economy’s standing is the one the world is least able to supply. Entrepreneurship, meaning the formation of AI companies and the capital ecosystem around them, is the lowest-scoring pillar in the Index at an average of 30.6 across the 103 economies carrying a score on it, against Data’s 62.8 across all 105. It is also the pillar that stands closest to overall standing, level with Investments as the strongest single correlate of an economy’s composite score. And it is the pillar that 89 of the 105 scored economies, 85 percent, carry among the three weakest capabilities that define their own development priorities. The scarcest capability is the decisive one, and it is where almost every economy’s own scores are weakest.
That result reframes what a national AI strategy is for. Most strategies of the past three years have concentrated on the things a government can procure or legislate: compute, data rulebooks, national strategies, training programs. The Index finds that those are the capabilities converging fastest and differentiating least. What separates economies is the harder thing, the formation of companies that turn research and capital into products, and that is precisely what no ministry can buy directly.
This summary sets out eleven numbered findings: nine results from the measurement itself, a tenth on the limits a reader should hold in mind while using it, and an eleventh on what the aggregate of 105 measured positions implies for the world’s AI development agenda. Each economy’s seven pillar scores combine into a single composite, the Ecosystem Development Score, or EDS, on a 0 to 100 scale, and every composite comparison in this report runs on it. The evidence sits in the chapters behind this summary: seven pillar narratives, six regional profiles, and roughly 450 pages of individual economy profiles. Every Index figure here is computed from the same dataset those chapters use, closed on 14 August 2026, and can be checked against it; external figures are attributed where they appear and listed at the end.
Each point is one of the Index’s seven pillars. The horizontal axis is the pillar’s global average score; the vertical axis is how strongly an economy’s score on that pillar tracks its standing on the other six. The relationship is strongly inverse, with a rank correlation of −0.86.
Visit: https://index.witsa.org/2026/